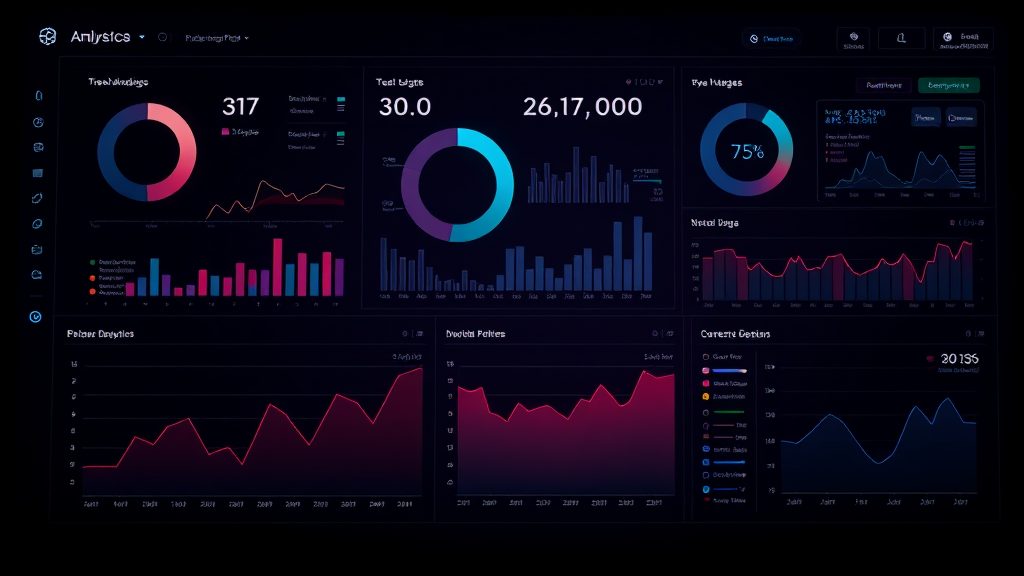
The average marketing team now manages data from fourteen different sources—and that number keeps climbing. Business intelligence tools have evolved from simple reporting platforms into sophisticated AI-powered systems that can surface insights your team would never catch manually. In 2026, the question isn’t whether your business needs BI capabilities, but which approach delivers the clearest path from raw data to revenue-driving decisions.
We’ve seen firsthand how the right analytics infrastructure transforms marketing performance. Teams that implement proper business intelligence don’t just get prettier dashboards—they cut reporting time by 60-70% while actually making smarter decisions. The challenge lies in navigating an increasingly complex landscape of tools, each promising to be the single source of truth your business desperately needs.
The Business Intelligence Landscape: Open-Source vs Enterprise Solutions
The BI tool ecosystem has fragmented into two distinct camps, each with compelling advantages for different business contexts. Open-source platforms like Apache Superset, Metabase, and Redash offer remarkable flexibility and zero licensing costs, while enterprise solutions such as Tableau, Power BI, and Looker provide polish, support, and integration depth that can justify their substantial price tags.
Open-source business intelligence tools have matured dramatically over the past three years. Metabase, for instance, now handles complex data modeling that previously required enterprise-grade solutions, and its semantic layer lets non-technical marketers build their own reports without writing SQL. We’ve deployed Metabase for e-commerce clients managing $2-5M in annual revenue who need sophisticated attribution modeling but can’t justify $50,000+ annual platform costs.
The trade-off comes down to technical resources and scale. Open-source tools require someone on your team—or an agency partner—who can handle setup, maintenance, and troubleshooting. You’ll need to manage your own database connections, optimize query performance, and handle version updates. For businesses with lean technical teams, this overhead often negates the cost savings within the first year.
Enterprise platforms shine when you need governance at scale. Power BI’s integration with the Microsoft ecosystem makes it nearly frictionless for organizations already running on Azure and Office 365. Tableau’s calculation engine handles datasets that would bring open-source alternatives to their knees. Looker’s LookML modeling language creates a single source of truth that prevents the “ten different revenue numbers” problem that plagues growing marketing teams.
The middle ground has emerged around tools like Metabase Cloud and Preset (the commercial version of Apache Superset), which offer open-source flexibility with managed hosting and support. These options typically run $500-2,000 monthly—substantially less than enterprise contracts while eliminating infrastructure headaches.
AI-Powered Query and Anomaly Detection in Modern Analytics
The integration of AI into business intelligence tools represents the most significant shift in analytics capabilities since the introduction of self-service BI a decade ago. Natural language query interfaces have progressed from clunky experiments to genuinely useful features that let marketers ask questions in plain English and receive accurate, contextual answers.
ThoughtSpot’s AI-powered search, for example, now correctly interprets queries like “show me conversion rate by channel for customers who spent over $500 last quarter” without requiring predefined reports or knowledge of underlying data structures. Our AI & Automation services team has seen this capability cut ad-hoc reporting requests by roughly 40%, freeing analyst time for actual strategic work rather than dashboard maintenance.
Anomaly detection has become table stakes for serious ai analytics tools in 2026. Rather than hoping someone notices when conversion rates drop 15% or cost-per-acquisition spikes on a specific campaign, modern platforms continuously monitor hundreds of metrics and surface statistically significant changes. Looker’s anomaly detection, powered by their Prophet forecasting algorithm, distinguishes between normal weekly seasonality and genuine problems that need immediate attention.
The practical impact shows up in response time. One of our retail clients discovered a tracking implementation issue within four hours of deployment—their BI tool flagged a 98% drop in mobile transaction events compared to the forecasted range. Before implementing automated anomaly detection, similar issues would go unnoticed for days or even weeks, resulting in corrupted data and misguided strategic decisions.
Predictive analytics features have also become more accessible. Tools like Microsoft Power BI now include one-click forecasting and key driver analysis that previously required separate data science tools. These capabilities help marketing teams move from “what happened?” to “what’s likely to happen?” and “which factors actually matter?”—the questions that drive meaningful budget allocation decisions.
The limitation worth acknowledging: AI-powered features require clean, consistent data to produce reliable insights. Garbage in, garbage out remains the fundamental law of analytics. Before investing in sophisticated AI capabilities, ensure your data collection practices are sound—starting with proper implementation of tracking through our Retention & Tracking services.
Integration Architecture: Connecting GA4, Salesforce, and Your Marketing Stack
The true power of business intelligence tools emerges when they successfully unify data from disparate sources into coherent, trustworthy analytics. In 2026, the typical marketing tech stack includes Google Analytics 4, a CRM like Salesforce or HubSpot, advertising platforms (Google Ads, Meta, LinkedIn), email marketing tools, and often a CDP or customer data warehouse. Making these systems speak the same language determines whether your BI investment delivers genuine insight or just more scattered reports.
GA4 integration presents unique challenges that many teams underestimate. Unlike Universal Analytics, GA4’s event-based model and sampling behavior require more sophisticated handling to produce reliable business intelligence. We recommend using BigQuery as an intermediary layer—GA4’s native BigQuery export provides unsampled data and complete control over how you model sessions, conversions, and attribution. Tools like Looker Studio (free) and Looker (enterprise) connect directly to BigQuery, enabling data visualization that reflects your actual business logic rather than GA4’s sometimes opaque calculations.
Salesforce integration requires attention to data freshness and transformation logic. Most BI platforms offer native Salesforce connectors, but these often sync only once daily and bring over raw object structures that don’t align with how marketers think about pipeline and revenue. The solution involves either using Salesforce’s own Einstein Analytics (now called Tableau CRM) or building transformation layers in tools like dbt (data build tool) that reshape CRM data into analysis-ready tables before your BI tool touches it.
Modern data warehouses like Snowflake, BigQuery, and Databricks have become the connective tissue that makes multi-source analytics actually work. Rather than connecting your BI tool directly to fifteen different APIs, you land all data in a warehouse first, then connect your visualization layer to a single, governed source. This architecture also enables the use of our free File Converter to handle ad-hoc data exports in various formats—converting CSV exports from ad platforms or JSON from APIs into Excel-friendly formats for quick analysis before formal pipeline integration.
The integration pattern we recommend for most mid-market companies: use Fivetran or Airbyte for automated data extraction, land everything in BigQuery or Snowflake, apply transformation logic with dbt, and then connect your BI tool to the resulting clean data models. This separation of concerns means switching BI platforms doesn’t require rebuilding your entire data infrastructure—you’re just swapping the visualization layer on top of stable data foundations.
Building Effective Marketing Dashboards That Drive Decisions
The difference between useful and useless marketing dashboards comes down to focus and context. We’ve audited hundreds of dashboards over the years, and the pattern is consistent: ineffective dashboards try to show everything, while effective ones ruthlessly prioritize the specific decisions they’re meant to inform. A dashboard designed for daily ad optimization should look completely different from one built for quarterly board reporting, yet many teams build one generic dashboard and wonder why nobody uses it.
Start with the decision framework. Before opening your BI tool, write down the specific questions this dashboard needs to answer and the actions those answers should trigger. For a paid media manager, that might be: “Which campaigns are spending above target CPA?” (action: pause or reduce bid), “Which ad sets show improving trends?” (action: increase budget), and “Where are we tracking toward monthly goals?” (action: shift budget allocation). Build dashboard sections around these decision points rather than just displaying available metrics.
Visual hierarchy matters more than most teams realize. The human eye processes information in predictable patterns—we scan from top-left to bottom-right, notice size and color before reading labels, and make judgments within milliseconds. Place your most critical metric (usually a goal-tracking KPI) prominently at the top. Use color sparingly and consistently—green for positive variance, red for concerning trends, gray for neutral context. Every element should earn its space by answering a specific question or providing essential context for interpretation.
Context transforms numbers from trivia into intelligence. Showing “3,247 conversions this month” means nothing without comparison points. Show it against last month, against the same month last year, against your target, and against the forecasted range. Modern business intelligence tools make this contextual layering straightforward—Power BI’s “smart narratives” even generate plain-English summaries that highlight the most statistically significant changes automatically.
Interactive filters enable one dashboard to serve multiple audiences without clutter. A single marketing performance dashboard can include department, channel, campaign, and date-range filters that let executives view high-level trends while specialists drill into their specific areas of responsibility. The key is setting intelligent defaults—the initial view should answer the most common questions without requiring any filter manipulation.
We recommend a three-tier dashboard structure for most marketing organizations: operational dashboards (daily metrics for channel managers), analytical dashboards (weekly deep-dives for marketing leadership), and strategic dashboards (monthly/quarterly performance for executives). Each tier uses the same underlying data but presents it at different levels of granularity and context appropriate to the decisions that audience needs to make.
What Should You Expect to Spend on Business Intelligence Tools?
Total cost of ownership for business intelligence tools typically ranges from $6,000 to $150,000 annually depending on data volume, user count, and solution complexity. The platform license represents only 40-60% of true costs—implementation, training, maintenance, and the opportunity cost of delayed insights make up the rest.
For small teams (under 10 users) with straightforward needs, expect $500-2,000 monthly for managed platforms like Metabase Cloud, Sigma, or basic Power BI Pro licenses. Mid-market organizations (10-50 users, multiple data sources, custom integrations) typically invest $3,000-8,000 monthly once you account for platform costs, data warehouse expenses, and integration tools. Enterprise deployments at scale easily reach $15,000-30,000 monthly when you include Tableau or Looker licensing, dedicated infrastructure, and specialized support.
The cost-benefit calculation should focus on time savings and decision quality rather than just license fees. A marketing team spending 20 hours weekly on manual reporting represents roughly $50,000 in annual labor costs. A BI solution that cuts that to 5 hours pays for itself even at the higher end of the cost spectrum. More importantly, faster access to accurate data typically improves campaign performance by 10-25% through better optimization and budget allocation—far exceeding any platform costs for businesses spending meaningfully on digital advertising.
Hidden costs to budget for include data warehouse expenses (BigQuery charges for storage and queries, Snowflake bills for compute time), ETL/integration tools ($500-5,000 monthly depending on data sources), and the internal or agency resources needed for initial setup and ongoing maintenance. We typically recommend clients allocate 1.5-2x the stated platform cost to account for the full ecosystem required to make BI actually work.
The ROI timeline varies considerably. Simple implementations delivering basic multi-source dashboards show value within 4-8 weeks. Sophisticated deployments involving complex data modeling, advanced analytics, and organization-wide adoption might take 6-12 months to deliver full benefits. The key is starting with a focused use case that solves a genuine pain point, proving value quickly, then expanding from that foundation rather than attempting to boil the ocean on day one.
Moving From Scattered Reports to Strategic Intelligence
The gap between basic reporting and genuine business intelligence comes down to integration, automation, and strategic focus. Scattered reports across platforms create an illusion of data-driven decision making while actually slowing down your team and obscuring the patterns that matter. In 2026, the technology barriers to proper BI implementation have largely dissolved—the remaining challenges are organizational and strategic.
Your next step depends on where you’re starting. Teams currently living in spreadsheets and native platform interfaces should prioritize consolidation first—get your critical data sources feeding into a single environment before worrying about advanced AI features or sophisticated visualizations. Organizations with basic dashboards in place but low adoption should focus on the decision framework we outlined: rebuild around specific questions and actions rather than just displaying available metrics. Mature analytics teams can push into predictive capabilities and automated insight generation that genuinely augment human judgment.
The business intelligence landscape will continue evolving rapidly, but the fundamental principles remain constant: clean data beats fancy algorithms, focused dashboards beat comprehensive ones, and insights that drive action beat insights that sit in weekly reports nobody reads. Whether you choose open-source flexibility or enterprise polish, make sure your BI investment serves your actual decision-making process rather than just creating more sophisticated ways to be overwhelmed by data.
Our team works with businesses at every stage of the analytics maturity curve, from initial GA4 implementation through sophisticated multi-touch attribution modeling. If you’re ready to transform scattered data into strategic advantage, reach out to discuss which BI approach makes sense for your specific situation and growth stage.