If you’re managing multiple Google Ads accounts for different brands, regions, or business units, comparing budget pacing across accounts becomes one of your most critical optimization levers. Without a systematic approach to monitoring how each account burns through its budget relative to performance, you’ll inevitably over-fund underperformers while starving your best revenue drivers. We’ve seen businesses waste tens of thousands of dollars monthly simply because they set budgets once and forgot to revisit allocation as performance shifted.
The challenge intensifies when you’re juggling five, ten, or twenty separate ad accounts. Each account has its own seasonality patterns, competitive dynamics, and conversion characteristics. What worked in Q1 might be hemorrhaging money by Q3. Your enterprise account might be delivering a 4:1 ROAS while your regional test account sits at 1.5:1, yet both consume budget at the same rate because no one’s actively managing the distribution. Smart ad spend pacing across multiple accounts isn’t just about setting daily limits—it’s about building a performance-responsive system that continuously reallocates dollars toward your highest-returning opportunities.
Establishing Your Multi-Account Performance Baseline
Before you can effectively compare budget pacing across accounts, you need to understand what each account has historically delivered. This isn’t about last month’s numbers—you need at least 90 days of clean data to account for seasonality, promotional cycles, and the natural variance in digital advertising performance. Pull revenue, spend, conversions, and ROAS for each account, segmented by month to identify trends rather than anomalies.
We typically calculate three key metrics for each account during this baseline phase. First, the historical ROAS average across the full 90-day window, which tells us the account’s typical efficiency. Second, the revenue contribution percentage—how much of your total paid advertising revenue comes from this specific account. Third, the spend volatility coefficient, which measures how much the account’s daily spend fluctuates relative to its budget cap. An account that consistently hits 95-100% of its daily budget has low volatility and is budget-constrained; one that swings between 40% and 90% has high volatility and likely has targeting or bidding issues.
Let’s use a real scenario. Imagine you’re managing four accounts: Account A (enterprise products) shows a 3.8:1 ROAS and contributes 62% of total revenue. Account B (regional expansion) delivers 2.1:1 ROAS and 18% of revenue. Account C (brand awareness) runs at 1.4:1 ROAS with 8% revenue contribution. Account D (seasonal products) varies wildly from 0.9:1 to 5.2:1 depending on the month but averages 2.7:1 and brings 12% of revenue. This baseline data immediately tells you Account A deserves the largest budget allocation, Account C needs either optimization or reduced investment, and Account D requires special handling for its seasonal swings.
Setting Performance-Based Daily Pacing Limits
Once you understand each account’s historical contribution, you can set daily pacing limits that reflect both performance and strategic priorities. The mistake most marketers make is dividing budgets equally or maintaining legacy allocations from years past. Multi-account budget management demands that you tie spend capacity directly to proven performance while leaving room for strategic testing.
Our framework allocates 70% of total available budget proportionally based on ROAS-weighted revenue contribution, 20% proportionally based on raw revenue contribution (to ensure scale isn’t completely ignored), and 10% as strategic reserve for testing and opportunity capture. Using the four-account example above, Account A would receive roughly 55-60% of total daily budget, Account B around 20-25%, Account D approximately 12-15%, and Account C just 5-8%. This isn’t arbitrary—it mathematically favors your proven performers while still funding your growth initiatives.
The daily pacing limits must also consider each account’s conversion window and typical customer journey length. If Account A drives enterprise deals with 45-day consideration cycles, you can’t judge its daily performance by same-day ROAS. Build your pacing limits with enough buffer to accommodate the natural lag between click and conversion. We generally set daily caps at 110% of the target average daily spend to allow for high-performing days while preventing catastrophic overspend. For the enterprise account targeting $1,500 average daily spend, the hard cap would sit at $1,650, giving the algorithm room to capitalize on strong conversion days without blowing the weekly budget by Tuesday.
How Do You Monitor Budget Pacing in Real-Time Across Multiple Accounts?
You implement automated monitoring using Google Ads scripts that pull spend data every few hours and compare it against your forecasted pacing curve. Manual daily checks simply don’t scale when you’re managing multiple accounts, and by the time you notice an overspend problem at the end of the week, you’ve already wasted budget you can’t recover.
The script architecture we use pulls current spend for each account, calculates the percentage of daily budget consumed, and compares it to the expected percentage based on time of day. If it’s 2:00 PM (roughly 58% through the advertising day for most businesses), an account that’s already spent 85% of its daily budget is pacing high and likely to exhaust funds before end of day. The script flags this account for immediate review. Conversely, an account at only 30% spend by 2:00 PM is pacing low and either has bidding issues, targeting problems, or simply isn’t competitive in its auctions.
Our team has built scripts that don’t just monitor—they alert and recommend. When comparing budget pacing across accounts, the script generates a daily dashboard showing each account’s pacing status (on track, high, or low), its current ROAS versus historical average, and a recommended action. For high-pacing accounts delivering above-average ROAS, the recommendation might be “Increase daily budget by 20%.” For high-pacing accounts with below-average ROAS, it’s “Review auction insights and adjust bids downward.” This transforms monitoring from a passive activity into an active optimization trigger.
The technical implementation uses Google Ads scripts combined with Google Sheets for dashboard visualization and email notifications for critical alerts. You can also integrate with Slack or other communication platforms to push real-time notifications when any account exceeds pacing thresholds. The key is making the data immediately actionable rather than buried in a spreadsheet someone checks on Friday afternoon. For businesses serious about digital advertising performance, this kind of automation has become table stakes in 2026.
Weekly Reallocation Based on Performance Trends
Real-time monitoring catches immediate problems, but strategic optimization happens at the weekly level when you can evaluate true performance trends and shift budget allocations accordingly. Every Monday, we review the previous week’s data across all accounts, looking specifically at ROAS trends, cost-per-acquisition movement, conversion rate changes, and impression share lost to budget constraints.
The reallocation decision matrix is straightforward but requires discipline to execute consistently. Accounts that improved ROAS week-over-week while maintaining or growing conversion volume receive budget increases, typically 10-15%. Accounts that declined in ROAS or saw conversion rates drop receive budget decreases or at minimum remain flat until they demonstrate recovery. The critical nuance is distinguishing between temporary performance dips (perhaps due to external factors like competitor promotions) and genuine efficiency degradation that demands budget reallocation.
Let’s return to our four-account scenario. In week one, Account A delivered its expected 3.8:1 ROAS but showed impression share lost to budget of 35%, meaning it could have spent significantly more at the same efficiency. Account B’s ROAS jumped from 2.1:1 to 2.9:1 as a seasonal product line launched. Account C remained stuck at 1.4:1. Account D’s seasonal products entered their off-season, dropping to 1.2:1. The reallocation decision is clear: increase Account A’s budget by 20-30% to capture that lost impression share, increase Account B by 15% to capitalize on the seasonal momentum, decrease Account D by 30% as it enters low season, and either optimize or further reduce Account C.
This weekly reallocation rhythm ensures your budget distribution stays aligned with current market conditions rather than outdated assumptions. Some weeks you’ll make significant shifts; other weeks you’ll make minor adjustments. The consistency of review matters more than the magnitude of changes. We’ve found that businesses implementing disciplined weekly reallocation see 15-30% improvement in blended ROAS across all accounts within 90 days, simply by moving budget away from underperformers toward proven winners.
Advanced Pacing Strategies for Seasonal and Volatile Accounts
Some accounts defy simple pacing rules because their performance swings dramatically based on seasonality, promotional calendars, or external market factors. Account D in our example—the seasonal products account—can’t be managed with static allocation percentages. It needs dynamic pacing rules that adjust based on calendar dates, inventory levels, or external triggers.
For these volatile accounts, we implement tiered pacing schedules that automatically adjust daily budgets based on predetermined conditions. During peak season (perhaps June through August for this account), the baseline daily budget might be $800. During shoulder season (April-May and September-October), it drops to $400. During off-season (November-March), it decreases to just $150 to maintain minimal presence without wasting spend. These tier transitions happen automatically through scheduling features in Google Ads or through scripts that modify budgets based on date ranges.
The more sophisticated approach ties pacing adjustments to real-time performance signals rather than just calendar dates. If the seasonal account’s ROAS exceeds 4:1 for three consecutive days, the script automatically increases daily budget by 25%. If it drops below 2:1 for three consecutive days, budget decreases by 25%. This creates a performance-responsive system that accelerates spend during hot streaks and protects budget during cold streaks, without requiring daily manual intervention.
We’ve also seen success with inventory-triggered pacing for e-commerce accounts. When popular products have high stock levels, increase budget allocation to those campaigns. When inventory drops below threshold levels, automatically reduce spend to avoid driving demand you can’t fulfill. This requires integration between your inventory management system and your ads platform, which is increasingly accessible through tools and platforms that our AI and automation services can help implement for businesses ready to move beyond manual management.
Building Your Budget Pacing Command Center
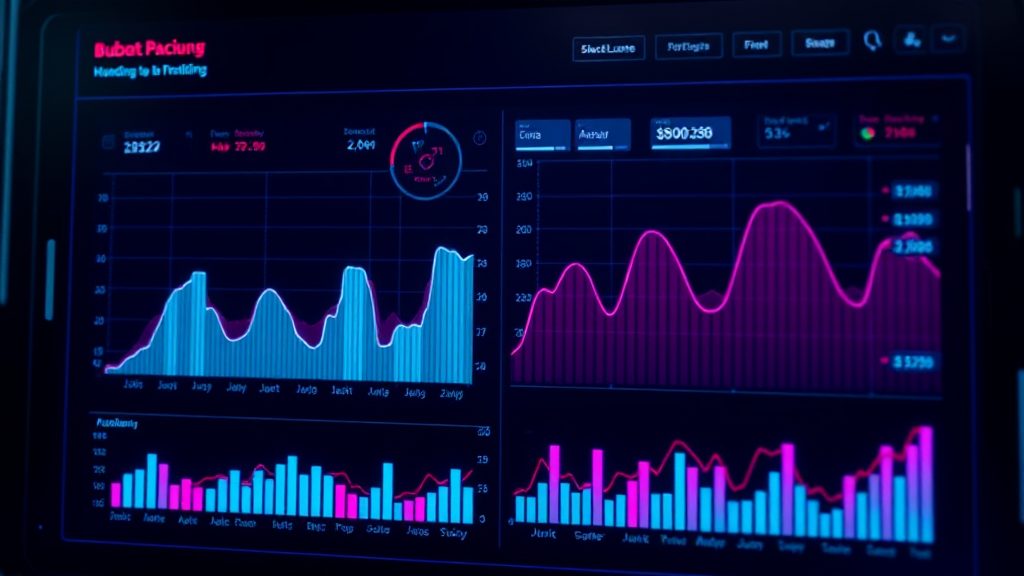
All these strategies collapse without a centralized view of performance across accounts. You need a single dashboard that shows at-a-glance status for every account: current spend versus target, ROAS versus historical baseline, pacing status, and recommended actions. Building this command center doesn’t require enterprise-level software—most of our clients run sophisticated multi-account monitoring through Google Sheets connected to Google Ads via scripts and API calls.
The dashboard should update automatically throughout the day and include visual indicators that make problems obvious. We use color coding: green for accounts pacing normally with healthy ROAS, yellow for accounts slightly off-pace but within acceptable ranges, red for accounts significantly over or under-pacing or showing ROAS degradation requiring immediate attention. A quick glance tells you where to focus your optimization time.
Beyond the real-time view, your command center needs historical trending charts that show how each account’s ad spend pacing and efficiency have evolved over weeks and months. Pattern recognition becomes your advantage—you’ll start noticing that Account B always performs better in the first two weeks of the month, or that Account A’s impression share drops every Thursday when competitors apparently increase their bids. These insights inform your pacing rules and allocation decisions, creating a flywheel of continuous improvement.
The command center also serves as your communication tool for stakeholders. When the CFO asks why advertising spend was $12,000 higher this month, you can show that the increase was strategically allocated to accounts delivering 4.5:1 ROAS while low-performing accounts were reduced by $4,000, resulting in a net improvement in overall efficiency. Data visibility transforms budget conversations from defensive cost justifications into strategic growth discussions.
Implementing Sustainable Budget Optimization
The framework we’ve outlined—baseline analysis, performance-based allocation, automated monitoring, weekly reallocation, and centralized dashboards—isn’t a one-time project. It’s an operating system for Google Ads optimization across multiple accounts. The initial setup requires investment in scripts, dashboards, and process documentation, but the ongoing maintenance becomes routine once the system is established.
Start with your top three to five accounts by revenue contribution. Build the baseline analysis, set initial pacing limits, implement basic monitoring scripts, and establish the weekly review cadence. Once this core group is running smoothly, expand to include additional accounts. Trying to implement sophisticated pacing across twenty accounts simultaneously typically leads to overwhelm and abandonment—better to build incrementally toward comprehensive coverage.
The businesses that win with multi-account budget management in 2026 are those that treat budget allocation as a dynamic optimization lever rather than a static planning exercise. Your competitors are likely still setting quarterly budgets and checking performance monthly. By implementing daily monitoring, weekly reallocation, and performance-responsive pacing rules, you’re operating at a completely different speed. You catch problems within hours rather than weeks, capitalize on opportunities while they’re still profitable, and systematically shift budget toward what’s actually working.
If you’re managing significant advertising spend across multiple accounts and ready to move beyond manual monitoring, our team at Markana Media helps businesses build these performance-responsive systems. We’ve implemented comparing budget pacing across accounts frameworks for clients spending from $50,000 to $5 million monthly, and the efficiency gains consistently justify the implementation investment within the first quarter. Visit our contact page to discuss how we can help you stop wasting budget on underperforming accounts and start systematically funding your winners.